of the 4.9.99 F4 Tornado
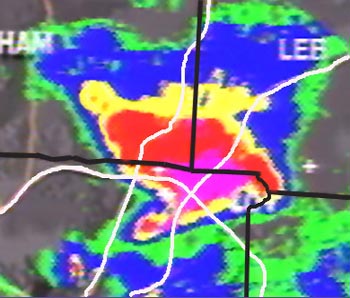 |
Video Freeze of PPI Display 5:13AM 4.9.99 See Close Up Below This PPI view is about 1600 ft. AGL. |
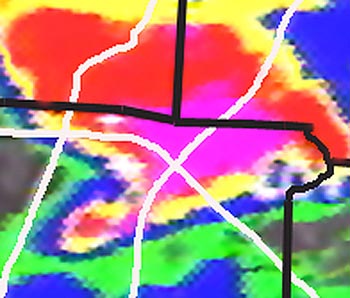 |
Close Up of Video Freeze of PPI Display 5:13AM 4.9.99 Use for Reference with diagrams below |
 |
SCHEMATIC BASE DIAGRAM AND COLOR KEY Green = Light Precipitation Blue = Moderate Precipitation Yellow = Heavy Precipitation Red = Very Heavy Precipitation Magenta = Turbulence The isolated magenta "dot" immediately west of I-71 is the tornado nearing or beginning to cross the interstate and about to cause the first fatality.The turbulence is caused by the extreme wind shear in the near-tornado environment. (See below for the cause of the large area of shear NE of the mesocyclone). |
 |
MESO-SCALE FRONTS At the surface the lowest pressure in found in the tornado. Trailing from the vicinity of the lowest pressure is a meso-scale cold front, basically the leading edge of the rear-flank downdraft (RFD) outflow. The red and yellow areas (heavy and very heavy precipitation) west and southwest of the tornado is convection, caused by lifting of the air by the advance of the RFD outflow. The quasi-stationary front to the northeast of the "L" is the boundary between the downdraft air, cooled by the evaporation precipitation and the warm, moist inflow spiraling upward into the center of low pressure - the mesocyclone. The evaporation-cooled air hugs the ground because of its density and aids in lifting the warm, moist inflow. |
 |
THE MESOCYCLONE Probably a (if not the) defining characteristic of a supercell thunderstorm is the mesocyclone. Meso means intermediate in size between large scale (the size of a continent) and small scale (a city block). The mesocyclone is a counter-clockwise rotating (northern hemisphere) center of low pressure in the supercell. The rotation probably arises from many sources, but most of the rotation is derived from two sources 1. wind shear in the environment that surrounds the supercell and concentration of rotational motion in the environment as air spirals into the supercell from the surrounding area. This may be from 50 square miles for a small supercell to hundreds of square miles for a large supercell. |
 |
INFLOW - 1 Three notches are evident in the top freeze of the PPI display are probably inflow notches. These notches (indicated at left and the third off the top of the diagram at right) indicate a counterclockwise spiraling of "drier" air into the supercell. Entrainment of dry air increases evaporation and could be a source of downsraft intensification. The notch at the right, NW of the tornado location is the rear flank downdraft air being pulled into the mesocyclone. |
 |
INFLOW - 2 The warm moist inflow, the source was a moist tongue (theta-e max - for non-meteorologists this is equivalent to saying a tongue of moist air, or a tongue of high dew point air) spirals into the supercell bringing a major source of storm energy - the latent heat of condensation. Energy used to evaporate the moisture is released as the warm, moist air rises in the supercell and the vapor condenses into liquid water. The large magenta area NE of the mesocyclone is turbulence caused by shear between rising warm, moist inflow and sinking, cool outflow. |